
Years of
Experience
I am Jamshaid
.png)
Data Scientist
I simplify complex data to create clear, reliable solutions that help businesses make smarter decisions
8083
8580
+Project
Completed
Completed
838080
Happy
Clients
Clients
8184
Industries
Served
Served
My Quality Services
We put your ideas and thus your wishes in the form of a unique web project that inspires you and you customers.
SERVICES
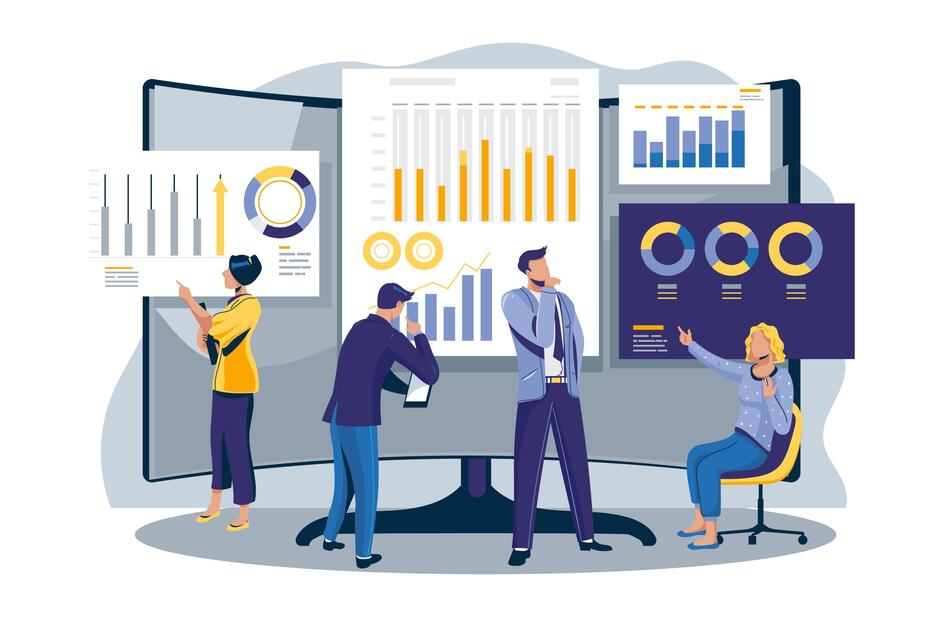
01. Valuable Insights
Data is powerful, but it becomes truly valuable only when it’s transformed into actionable insights. By analyzing your data, I help you uncover trends, patterns, and key findings that can guide smarter decisions and drive business growth. Whether it’s identifying inefficiencies, uncovering market opportunities, or understanding customer behavior, valuable insights are the foundation for strategic planning and long-term success.
What Are Valuable Insights?
Valuable insights are actionable conclusions drawn from data that offer meaningful and relevant information for decision-making. These insights help businesses understand the reasons behind patterns, predict future outcomes, and make more informed decisions. They are derived from analyzing data and applying statistical and analytical techniques to uncover hidden opportunities, optimize processes, and identify trends that may not be immediately apparent.
Why Are Valuable Insights Important?
In today’s fast-paced, data-driven world, the ability to extract valuable insights from data is crucial for staying competitive. Data alone is not enough—organizations need to translate that data into actionable information that drives business growth. Here’s why valuable insights are so important:
- Better Decision-Making: By uncovering key trends and insights, businesses can make decisions based on facts rather than assumptions, reducing risks and improving outcomes.
- Competitive Advantage: Insights into customer behavior, market trends, and operational performance can help businesses gain an edge over competitors who lack a clear understanding of their data.
- Optimized Processes: Analyzing data allows businesses to identify inefficiencies and areas for improvement, helping them streamline operations and reduce costs.
- Innovation and Growth: By identifying emerging opportunities, businesses can innovate their products, services, or marketing strategies, leading to new avenues for growth.
How Are Valuable Insights Extracted?
Valuable insights are not just about looking at raw data—they require deep analysis, the right tools, and expert interpretation. Here's how valuable insights are typically extracted from data:
- Data Collection: First, accurate and relevant data is gathered from various sources, including internal systems, customer interactions, and external market data.
- Data Cleaning and Preparation: Raw data is cleaned and prepared for analysis to ensure accuracy, consistency, and completeness.
- Exploratory Data Analysis (EDA): This stage involves analyzing the data to identify trends, correlations, and anomalies using statistical methods and visualizations.
- Advanced Analytics: More advanced techniques, such as predictive modeling, regression analysis, and machine learning, are used to uncover deeper insights, forecast future trends, and provide recommendations.
- Insight Interpretation: Finally, insights are interpreted and translated into actionable recommendations that can guide strategic decision-making.
Types of Valuable Insights
There are various types of insights that can be drawn from data, each offering unique value for different aspects of your business:
- Customer Insights: Understanding customer preferences, behaviors, and pain points helps businesses improve products, create personalized experiences, and optimize marketing strategies.
- Market Insights: By analyzing industry trends, competitor performance, and market dynamics, businesses can identify new opportunities, assess potential risks, and position themselves strategically.
- Operational Insights: These insights help businesses optimize processes, reduce inefficiencies, improve resource allocation, and boost productivity.
- Financial Insights: Insights into financial performance, such as profit margins, cash flow, and ROI, help businesses make sound financial decisions and plan for sustainable growth.
How Valuable Insights Can Drive Your Business Forward
Valuable insights help businesses stay ahead of the competition by providing clear guidance on where to focus efforts and resources. Here are several ways valuable insights can directly contribute to business success:
- Informed Strategic Planning: Data-driven insights enable leaders to make well-informed decisions that align with business goals and market demands.
- Enhanced Customer Engagement: By understanding customer needs and preferences, businesses can create more personalized and relevant experiences, leading to higher customer satisfaction and loyalty.
- Improved Marketing Effectiveness: With insights into customer behavior and market trends, businesses can fine-tune marketing campaigns for better targeting, messaging, and overall ROI.
- Optimized Resource Allocation: Valuable insights allow businesses to allocate resources more effectively, ensuring that efforts are focused on the areas with the highest potential for return.
Unlock the Power of Your Data with Valuable Insights
Don’t let your data go underutilized—unlock its full potential by transforming it into actionable insights. With a deeper understanding of your business, customers, and market, you can make smarter decisions that lead to measurable results. Whether it’s improving operations, driving growth, or enhancing customer experiences, valuable insights provide the clarity needed to take your business to the next level.
SERVICES
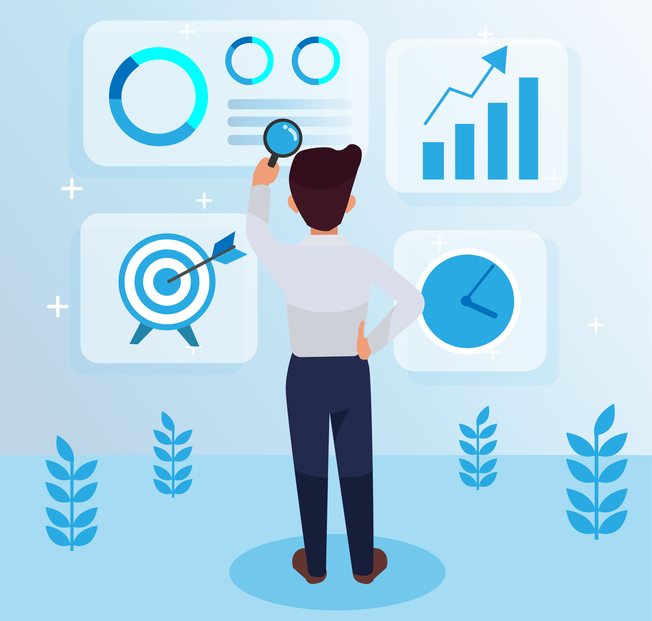
02. Forecasting
Forecasting is a powerful tool that enables businesses to predict future trends, behaviors, and outcomes based on historical data. With the right techniques and models, forecasting can provide invaluable insights that help businesses stay ahead of the curve, make informed decisions, and drive growth. Whether you're predicting market trends, customer demand, or sales performance, forecasting empowers you to plan effectively and take proactive actions.
What is Forecasting?
Forecasting is the process of using historical data and statistical methods to predict future events or trends. It involves analyzing past performance and identifying patterns that can be used to project future outcomes. This approach is vital for decision-making, as it helps organizations anticipate challenges, capitalize on opportunities, and optimize resource allocation.
The Importance of Accurate Forecasting
Accurate forecasting is crucial for businesses to stay competitive in today’s fast-paced world. It provides a roadmap for strategic planning and decision-making, ensuring that businesses are prepared for the future. With the right forecast, you can align your resources effectively, reduce risks, and optimize your operations. Whether you’re forecasting sales, market demand, or financial performance, accurate predictions allow businesses to be proactive rather than reactive.
Key Techniques in Forecasting
There are several techniques used in forecasting, each with its strengths depending on the data and objectives. Common methods include:
- Time Series Analysis: This method analyzes historical data to identify trends, seasonal patterns, and cycles, making it ideal for forecasting demand, sales, and other recurring metrics.
- Regression Analysis: Regression models identify the relationship between variables and predict future outcomes based on independent factors.
- Machine Learning Models: Advanced techniques like neural networks and decision trees can be used to forecast complex patterns, offering high accuracy in dynamic environments.
How Forecasting Works
The forecasting process begins with gathering and preparing data. This data is then analyzed using various techniques, such as time series or regression analysis, to identify patterns and trends. Once the model is built, it can be used to predict future outcomes. These predictions are continuously refined as new data becomes available, improving their accuracy and reliability.
Benefits of Forecasting
Forecasting offers several key benefits that can greatly enhance your business strategy:
- Improved Decision-Making: Forecasting enables better-informed decisions by providing a clear outlook on future trends and behaviors.
- Cost Efficiency: By anticipating future needs, businesses can optimize resource allocation, reduce waste, and avoid overproduction.
- Competitive Advantage: A well-executed forecast helps you stay ahead of competitors by predicting market shifts, customer demand, and emerging trends.
- Risk Management: Accurate forecasting helps identify potential risks, allowing businesses to mitigate them before they impact operations.
Real-World Applications of Forecasting
Forecasting can be applied across various industries to achieve strategic objectives. Here are some common use cases:
- Retail: Predicting customer demand to optimize inventory management and reduce stockouts or overstock situations.
- Finance: Forecasting market trends, stock prices, and economic conditions to make informed investment decisions.
- Manufacturing: Predicting production needs to optimize supply chain management and reduce costs.
- Marketing: Anticipating customer behavior and market demand to tailor marketing campaigns and improve ROI.
Taking Action Based on Forecasting Insights
Forecasting doesn’t just predict the future; it enables businesses to take proactive action. With a clear understanding of future trends, businesses can adjust their strategies, allocate resources efficiently, and make informed decisions that position them for success. Whether it's adjusting marketing campaigns, optimizing operations, or planning financial strategies, forecasting provides the foundation for effective action.
By leveraging advanced forecasting techniques, businesses can not only anticipate what’s coming but also shape their future with confidence. With accurate predictions, you’ll be empowered to make smarter, more strategic decisions that drive growth and success.
SERVICES
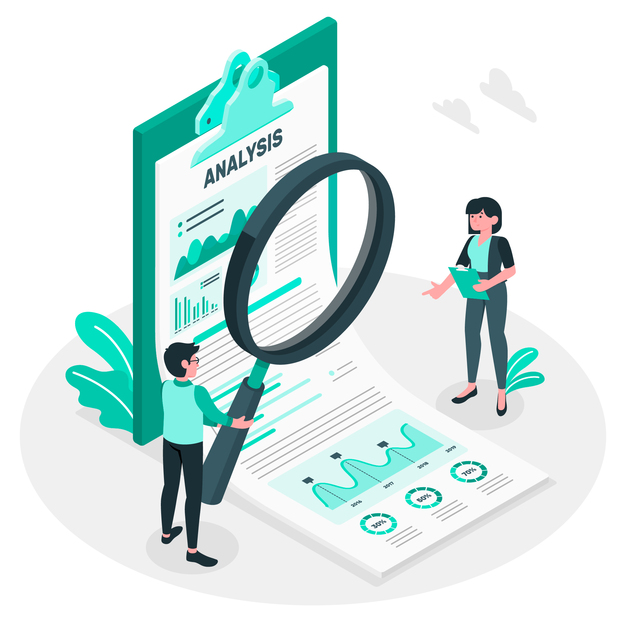
03. Advanced Analysis
Advanced analysis is the key to unlocking the true value of your data. By applying sophisticated techniques and state-of-the-art tools, we dive deep into your data to uncover insights that aren’t immediately obvious. This process can lead to groundbreaking discoveries, better decision-making, and a competitive edge in your market.
What is Advanced Analysis?
Advanced analysis goes beyond basic descriptive statistics. It uses complex algorithms, machine learning models, and data mining techniques to explore your data in ways that simple reports and visualizations cannot. This analysis uncovers hidden patterns, correlations, and trends that can have a profound impact on your business.
The Power of Data Exploration
We begin with a comprehensive exploration of your data, identifying key features and variables that are essential for deep analysis. This step helps to understand the structure, quality, and potential of your data, ensuring that no critical information is overlooked. By using advanced exploratory data analysis (EDA) techniques, we can spot anomalies, outliers, and hidden relationships that might not be apparent at first glance.
Identifying Patterns and Trends
Using powerful statistical models and machine learning algorithms, we identify complex patterns and trends within your data. Whether it’s customer behavior, operational efficiencies, or market shifts, these insights allow you to make data-driven decisions with confidence. This deeper understanding can help you uncover new opportunities, optimize existing processes, and predict future outcomes.
Predictive Modeling and Forecasting
One of the key aspects of advanced analysis is predictive modeling. By creating models that forecast future trends, behaviors, or outcomes, we help you anticipate challenges before they arise. These forecasts enable proactive decision-making, allowing you to stay ahead of the curve and adjust strategies as needed to remain competitive in a fast-moving market.
Actionable Insights
Advanced analysis doesn’t just tell you what happened in the past; it tells you why it happened and what actions to take next. With clear, actionable insights, you can make informed decisions that drive growth, improve operational efficiency, and enhance customer satisfaction. These insights are often visualized in interactive dashboards or detailed reports, making them easy to share and understand at all levels of your organization.
Real-World Impact
Advanced analysis leads to tangible results. Whether you’re looking to optimize your supply chain, predict customer behavior, or explore new revenue streams, the insights derived from advanced analysis can transform the way you do business. It empowers you to act strategically, make data-backed decisions, and drive real change in your organization.
By leveraging advanced analysis, you unlock the full potential of your data. With powerful tools and expert techniques, I help you uncover hidden insights that can propel your business forward, providing the clarity and direction needed for long-term success.
SERVICES
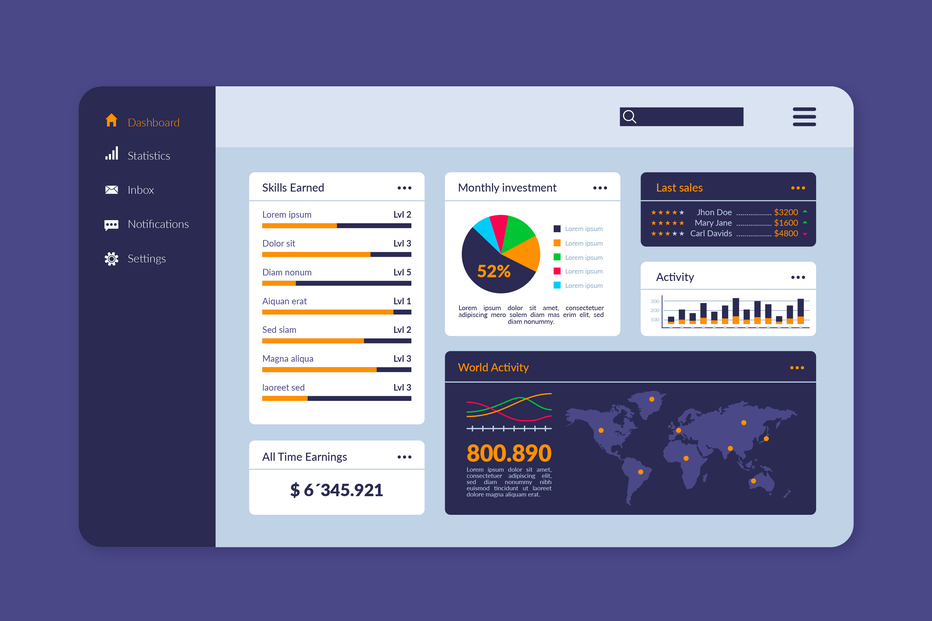
04. Reports and Dashboards
Reports and dashboards are essential tools for presenting data in an easily digestible format. They transform complex datasets into clear, actionable insights that help decision-makers understand trends, monitor performance, and take informed actions. Whether you're presenting business performance, tracking KPIs, or analyzing customer behavior, reports and dashboards help turn raw data into valuable, accessible information.
What Are Reports and Dashboards?
Reports and dashboards are data visualization tools that provide insights into key metrics, trends, and performance indicators. Reports are typically static, detailed documents that focus on specific data points, while dashboards are dynamic and interactive, allowing users to monitor real-time data and track multiple metrics at once. Both tools help organizations make sense of their data by presenting it in an intuitive format that is easy to understand and act upon.
Why Are Reports and Dashboards Important?
Reports and dashboards allow businesses to quickly assess their current performance, identify areas for improvement, and make data-driven decisions. With these tools, stakeholders at every level can gain insights into critical aspects of the business without having to dive deep into raw data. They serve as the bridge between complex analytics and actionable insights, ensuring that key data points are communicated effectively to the right people at the right time.
Key Features of Effective Reports
Effective reports provide clear, concise, and actionable information. Some key features include:
- Clarity: The data should be presented in a simple, clear, and organized manner, avoiding unnecessary jargon.
- Context: Data points should be placed in context, with explanations of their significance and relevance to business goals.
- Key Insights: Reports should highlight the most important findings and offer recommendations for action based on the data.
- Visual Appeal: Using charts, graphs, and tables to break down complex data makes it easier to interpret and understand.
Key Features of Effective Dashboards
Dashboards provide a real-time overview of business performance and metrics. Some essential features of an effective dashboard include:
- Real-Time Data: Dashboards should update in real-time to reflect the latest data, ensuring that users can make decisions based on the most current information.
- Interactivity: Users should be able to filter, drill down, and explore different datasets to gain deeper insights into specific aspects of the business.
- Customization: Dashboards should be customizable to the user’s role or preferences, ensuring that the most relevant data is prioritized.
- Visualization: Dashboards should present data using visual elements like charts, graphs, and maps to make complex data easier to understand at a glance.
How Reports and Dashboards Work Together
While reports and dashboards serve different purposes, they work best when used together. Reports offer in-depth analysis and detailed insights that help users understand the "why" behind data trends. Dashboards, on the other hand, provide real-time visibility into key metrics and enable users to monitor performance on an ongoing basis. Together, these tools offer a comprehensive approach to data analysis, helping businesses make informed decisions based on both historical insights and real-time performance.
Benefits of Using Reports and Dashboards
Reports and dashboards offer several advantages for businesses:
- Faster Decision-Making: With real-time access to relevant data, businesses can make decisions more quickly and efficiently, improving responsiveness.
- Improved Communication: These tools make it easier to share data with teams, stakeholders, and clients, ensuring everyone is aligned on key performance metrics.
- Increased Accountability: Dashboards and reports provide a clear view of individual and team performance, helping to identify areas of success and areas needing improvement.
- Better Data-Driven Decisions: With reports and dashboards, businesses can base their decisions on concrete data, reducing the reliance on gut instinct and assumptions.
Real-World Applications of Reports and Dashboards
Reports and dashboards can be applied in a variety of business contexts to achieve strategic goals:
- Financial Reporting: Dashboards and reports can track financial performance, revenue, expenses, and profitability, helping finance teams make informed budgeting and forecasting decisions.
- Marketing Analytics: Marketing dashboards help track campaign performance, website traffic, customer engagement, and conversion rates in real-time, ensuring marketing efforts are optimized.
- Sales Performance: Sales teams can use dashboards to monitor sales targets, pipeline progress, and customer acquisition metrics, helping to identify potential opportunities and bottlenecks.
- Operations Monitoring: Dashboards can be used to track key operational metrics like production rates, inventory levels, and supply chain performance, ensuring smooth operations.
Transform Your Business with Custom Reports and Dashboards
With the right reports and dashboards, you can unlock the full potential of your data and make smarter, more informed decisions. Whether you need a comprehensive report to share with stakeholders or an interactive dashboard for real-time performance monitoring, I can help create customized solutions tailored to your specific needs. Empower your team with the tools they need to succeed and turn your data into actionable insights that drive business growth.
My Recent Works
We put your ideas and thus your wishes in the form of a unique web project that inspires you and you customers.

Udacity Self-Driving Car Simulator Project
This project uses a Convolutional Neural Network (CNN) to autonomously drive a car in a simulated environment.

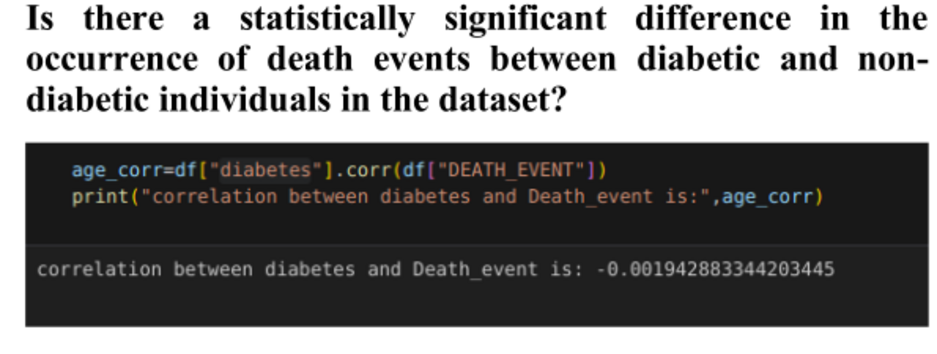
Exploring Patient Characteristics and Mortality in Heart Failure
A data-driven analysis of heart failure patient characteristics to uncover factors influencing mortality, using statistical insights and machine learning for improved healthcare outcomes.

Exploring Road Traffic Accidents: A Data-Driven Approach to Improving Safety
This project focuses on analyzing road traffic accidents in Westminster, London, using the CRISP-DM model for data mining.

Real-Time Accident Analysis in London: Predicting Severity and Weather Conditions
This project focuses on real-time accident data in London, utilizing data collection, cleaning, and preprocessing techniques to uncover patterns in accident severity and weather conditions.
.jpg)
Udacity Self-Driving Car Simulator Project
This project uses a Convolutional Neural Network (CNN) to autonomously drive a car in a simulated environment. The primary obto autonomous driving


Project Description
T without human input. By leveraging deep learning techniques and computer vision, this project explores how neural networks can enhance the capabilities of self-driving cars.
The story
In the world of autonomous driving, the challenge lies in enabling vehicles to interpret their surroundings accurately and make real-time decisions. This project begins with the collection of driving data in a simulated environment, where a car is manually driven around the track while capturing camera images and corresponding steering angles. The data collected serves as the foundation for training a neural network model. As the project progresses, various techniques are employed to ensure the model learns effectively and can generalize well to new scenarios. The story unfolds through a series of iterations, where data preprocessing, model design, and training strategies are refined to enhance the car's driving performance.
OUR APPROACH
We gathered extensive driving data from the simulator by manually controlling the car, recording images and steering angles from multiple camera perspectives (center, left, and right).
The collected data underwent preprocessing to improve its quality. This included resizing images, normalizing pixel values, and cropping irrelevant sections to focus on the road ahead.
The model was trained using the Mean Squared Error (MSE) loss function and the Adam optimizer, optimizing the network to reduce prediction errors and improve performance.
After training, the model's performance was evaluated using a test dataset to assess its ability to generalize to new driving scenarios. We employed data augmentation techniques and hyperparameter tuning to refine the model further.
Exploring Patient Characteristics and Mortality in Heart Failure
A data-driven analysis of heart failure patient characteristics to uncover factors influencing mortality, using statistical insights and machine learning for improved healthcare outcomes.
Project Description
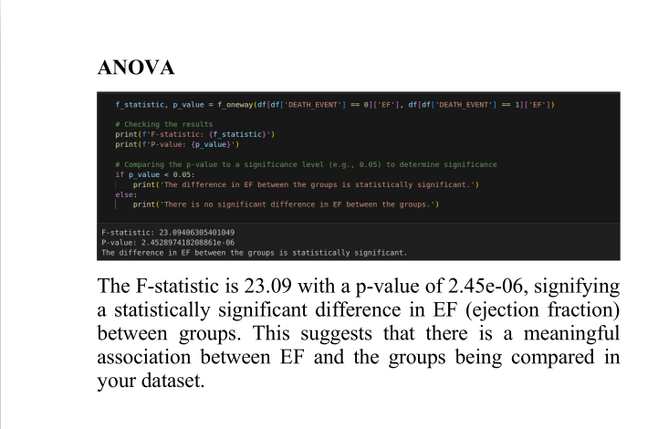
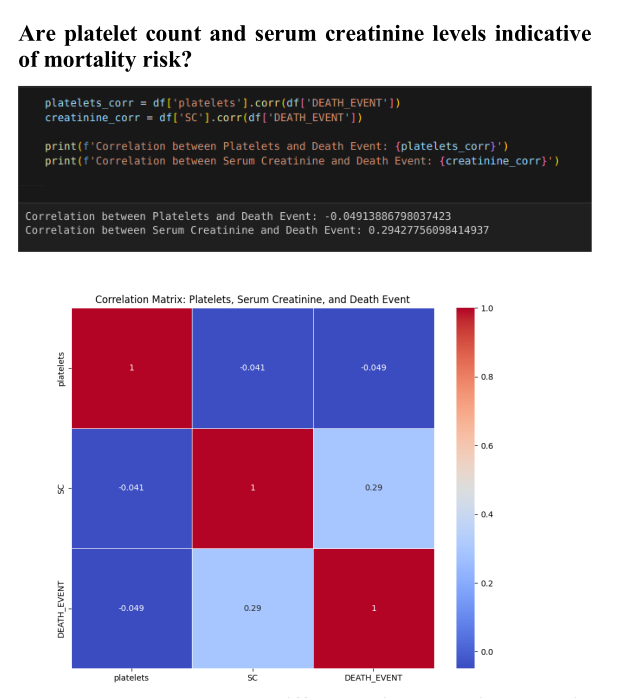
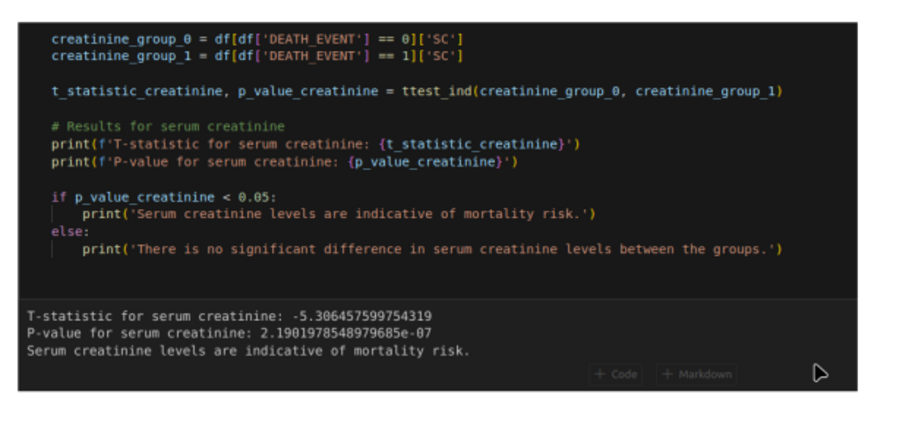
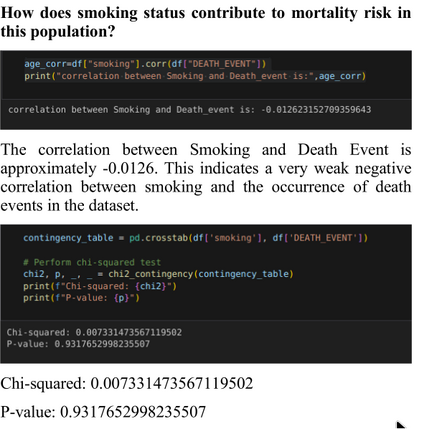
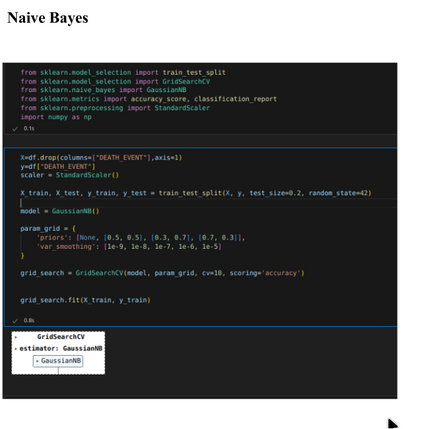
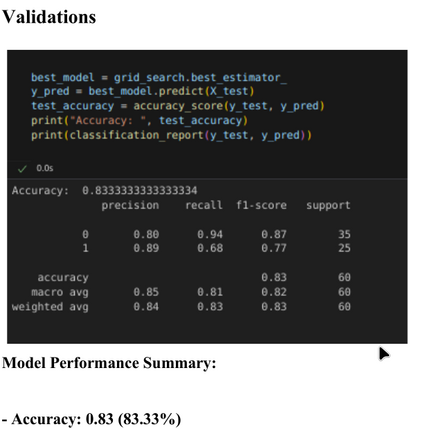
This project dives deep into understanding the factors influencing mortality in patients diagnosed with heart failure. By analyzing demographic, clinical, and lifestyle data, we uncover patterns and predictors of survival. Through statistical analysis and machine learning techniques, this work offers valuable insights for healthcare professionals, helping them to better assess patient risk and improve outcomes.
The story
Our journey began with a question: What drives mortality in heart failure patients, and how can we predict it? As data enthusiasts, we realized the potential of leveraging medical data to answer critical healthcare questions. With a blend of curiosity and determination, we embarked on this project to explore the hidden patterns within patient data. By connecting data to impactful insights, we aim to contribute to the ongoing efforts to save lives and improve patient care.
OUR APPROACH
We explored the dataset, identifying key variables such as age, medical history, and comorbidities, and examined their impact on patient outcomes.
Ensured data quality through cleaning, handling missing values, and feature engineering.
Conducted exploratory data analysis (EDA) using advanced visualization tools to uncover meaningful relationships.
Leveraged machine learning algorithms to predict mortality, optimizing models for accuracy and interpretability.Translated findings into actionable insights to aid healthcare providers in risk assessment and decision-making.
Exploring Road Traffic Accidents: A Data-Driven Approach to Improving Safety
pThis project focuses on analyzing road traffic accidents in Westminster, London, using the CRISP-DM model for data mining.
Project Description
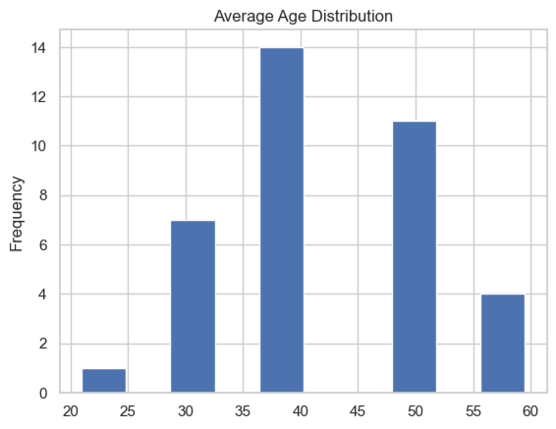
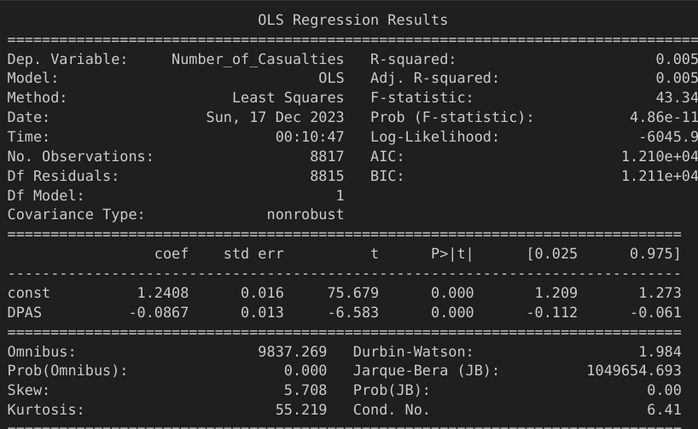
This project focuses on analyzing road traffic accidents in Westminster, London, using the CRISP-DM model for data mining. It aims to uncover the key factors influencing road safety and their economic impact on the local community. Through a dataset of 8,855 records spanning 2005-2010, statistical models, regression analysis, and clustering algorithms, the study offers critical insights into the causes of accidents and their severity, informing better traffic management and policy decisions.
The story
In this study, we explore road traffic accidents in Westminster to identify patterns, correlations, and underlying factors that contribute to accidents and their severity. Using a rich dataset that spans several years, we analyze variables like weather conditions, road surface types, and law enforcement presence. The goal is not only to understand the contributing factors but also to provide actionable insights that can help local authorities reduce accidents and their economic impacts on businesses and the broader community.
OUR APPROACH
Our approach follows the CRISP-DM (Cross-Industry Standard Process for Data Mining) methodology, ensuring a structured, repeatable process for analyzing the data. We begin with data exploration and pre-processing to clean and prepare the dataset.
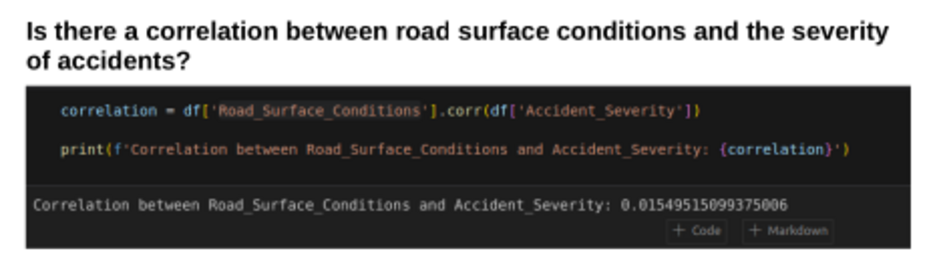
Then, statistical analyses and regression models help us identify correlations and significant factors affecting accident severity.
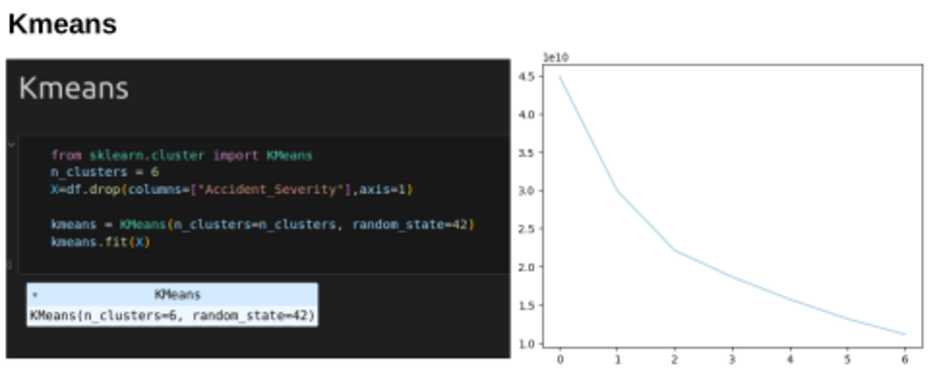
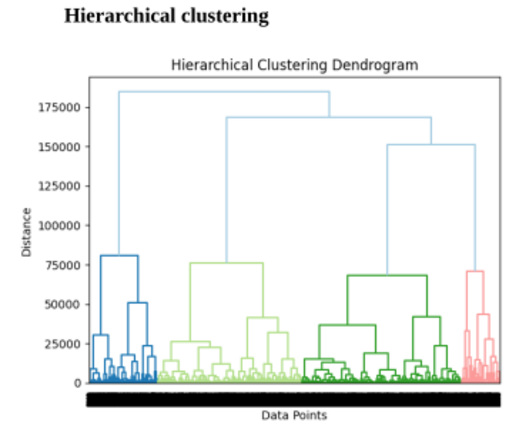
We also apply machine learning techniques, such as k-means clustering, to segment accident data and gain deeper insights.
The results reveal key drivers of traffic accidents and offer recommendations for improving road safety and mitigating economic losses.
Real-Time Accident Analysis in London: Predicting Severity and Weather Conditions
This project focuses on real-time accident data in London, utilizing data collection, cleaning, and preprocessing techniques to uncover patterns in accident severity and weather conditions.
Project Description
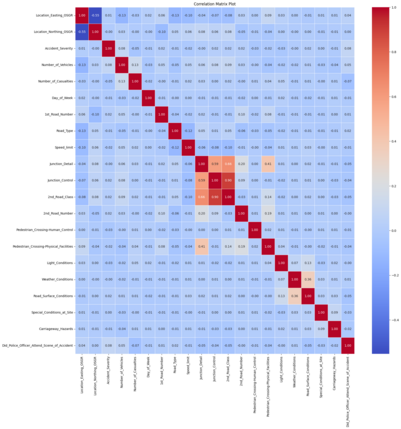
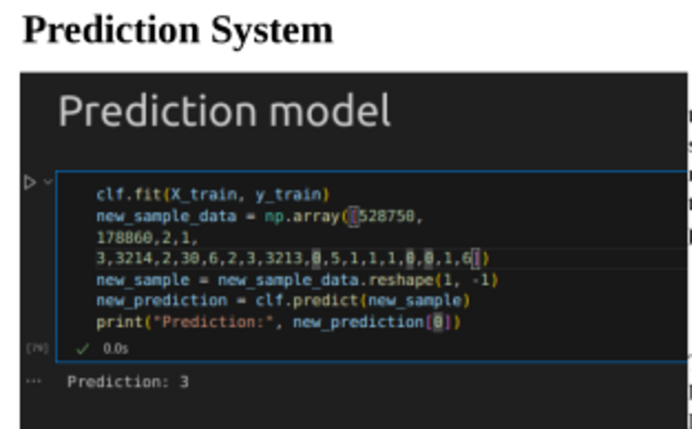
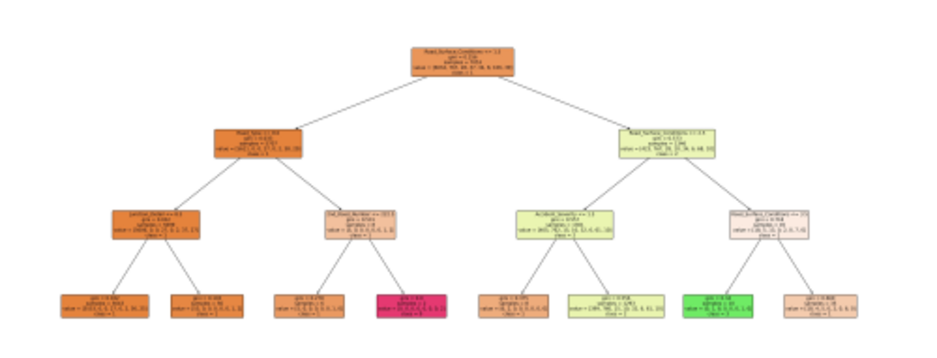
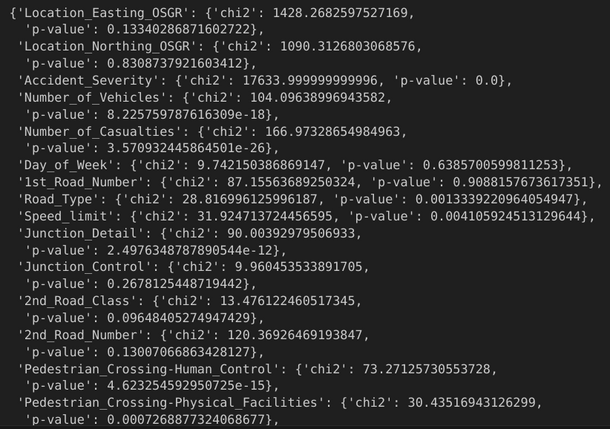
This project focuses on real-time accident data in London, utilizing data collection, cleaning, and preprocessing techniques to uncover patterns in accident severity and weather conditions. Through Exploratory Data Analysis (EDA), feature engineering, and advanced machine learning models like decision trees, the study provides insights into factors influencing accident severity, including latitude, weather, speed limits, and casualties.
The story
In this study, we aim to enhance road safety in London by analyzing real-time traffic accident data. By leveraging data science tools and techniques, we investigate the factors that influence the severity of accidents, the correlation between weather and latitudinal factors, and the role of speed limits in accident outcomes. The ultimate goal is to develop predictive models that can help anticipate accident severity and weather conditions, enabling better traffic management and policy decisions to reduce accidents and casualties.
OUR APPROACH
We apply a structured data science approach, starting with the collection, cleaning, and preprocessing of real-time accident data. Exploratory Data Analysis (EDA) helps us identify key patterns, while feature engineering optimizes the predictive power of our models.
We conduct a correlation analysis to explore relationships between accident severity, weather conditions, and other factors. Cluster analysis groups accident data to reveal common characteristics, while decision trees are used to predict accident severity and weather.
Model evaluation shows strong performance with high precision (90.53%), recall (88.29%), and accuracy (88%), ensuring reliable predictions and actionable insights.
My Experience
Courses And My Education
My Skills
We put your ideas and thus your wishes in the form of a unique web project that inspires you and you customers.

92%
Python
80%
Deep Learning
85%
SQL

99%
Data Visualization

89%
Statistical Analysis

93%
Machine Learning
My Client's Stories
Empowering people in new a digital journey with my super services


Jamshaid is a talented Data Scientist whose analysis provided us with critical insights, helping our business stay competitive in the market.
Andy Inzerillo
Real Estate Broker in the State of Missouri

“Jamshaid is a professional Data Scientist he really helps my business by providing value to my business.
Larry and Louise Oeffling
Owner, Ellicottville Real Estate

Jamshaid’s data analysis skills are exceptional. He helped us uncover hidden patterns in our data, resulting in improved business strategies.
Roger Wolff
Fairtax Consulting

The scraping solution was quick and efficient, saving us time and resources. value to my business.
Brant Elsberry
President at Chartwell Realty LLC

The deep learning model helped us predict property values with incredible accuracy, boosting our real estate investment decisions value to my business.
Chris Fleming
Owner, Fleming Real Estate
Deep learning helped us analyze historical real estate data, improving our ability to forecast future market conditions
Fred Fisher
Owner, Fisher Real Estate

“Jamshaid is a professional Data Scientist he really helps my business by providing value to my business.
Donna Marston
Owner at Homequest Real Estate

Jamshaid is a talented Data Scientist whose analysis provided us with critical insights, helping our business stay competitive in the market.
Tim Hardeman
Owner at Hardeman Real Estate
“Jamshaid is a professional Data Scientist he really helps my business by providing value to my business.
Larry and Louise Oeffling
Owner, Ellicottville Real Estate
.jpg)
Great work! Jamshaid’s scraping skills gave us valuable data, and his analysis helped us grow.
Ed Justice
Independent Contractor
.jpg)
We saw immediate benefits from the deep learning models, especially in optimizing our processes.
Allen Parks
Owner at Parks Real Estate
We saw noticeable improvements in customer behavior predictions after implementing deep learning models value to my business.
Scott Baker
Owner
The deep learning model helped us predict property values with incredible accuracy, boosting our real estate investment decisions
Chris Fleming
Owner, Fleming Real Estate
Jamshaid is a talented Data Scientist whose analysis provided us with critical insights, helping our business stay competitive in the market.
Tim Bailey
SEO Specialist, Theme Junction
Jamshaid’s data analysis skills are exceptional. He helped us uncover hidden patterns in our data, resulting in improved business strategies.
Roger Wolff
Fairtax Consulting
Jamshaid is a talented Data Scientist whose analysis provided us with critical insights, helping our business stay competitive in the market.